Via Peter Tchir:
At this point it is clear that there is no single person in America, and possibly the planet who can influence markets as much as the Chairman of the Federal Reserve Board. The president may have more overall power (possibly) but in terms of moving markets for weeks at a time, that power primarily belongs to Mr. Bernanke. An unelected official with almost total control over the “board” he chairs.
Some have argued whether the Fed should even exist. I won’t go that far (it is beyond my scope), and I even understand why the Fed needs some independence. But I don’t understand why he isn’t accountable or why there aren’t limits.
The “Voting” Constraint
In theory the Fed has a board that votes. In fact there are actually 2 boards. The first is the Fed Board of Governors, which consists of 7 members (5 at the moment), appointed by the President and confirmed by the Senate for 14 year terms. The Board of Governors sets the discount rate and the reserve requirements. The second is the Federal Open Market Committee (FOMC), which consists of 12 members (10 at the moment), who are the 7 members of the Fed Board of Governors, the President of the Federal Reserve Bank of New York, and 4 other Presidents of the regional Federal Reserve Banks (on 1 year rotating basis). The Presidents of the other regional Federal Reserve Banks participate in the discussions but do not have a vote. Congress, effectively, no meaningful influence on the Fed since no appropriations come from Congress – Fed pays its bills from its own operations. FOMC sets the open market operations policy including the target Fed Funds rate.
In theory, the Chairman has the same one vote as the other members of the boards, but never in the history of the Fed has the chairman been on the losing side of the vote. In fact, multiple dissents are rare. The chairman may have the same vote but it is clear he is the leader. Whether the other board members are meant to be independent, there is a clear chain of command, and they are effectively subordinate to him regardless of what was intended. If the President of the United States wanted to call a board member directly, we have no doubt that it would be okay. If a board member called the President directly, I expect there would be repercussions. Only the chairman holds the post announcement press conference. He has the 60 minutes interviews. Whatever the intention was, it is impossible to argue that in practice the Fed Chairman is the boss of the others, and the idea of “team” is more reminiscent of the baseball bat scene in the “Untouchables” than a meeting of peers.
“Need To Know”
Why is there such a “need to know” level of secrecy surrounding many of their policies. The Government Accountability Office (GAO) does audit the Fed but its oversight of the Fed system is limited to areas outside of monetary policy. In fact, the “GAO can’t review most of the Fed’s monetary policy actions or decisions, including discount window lending (direct loans to financial institutions), open-market operations and any other transactions made under the direction of the Federal Open Market Committee. It also can’t look into the Fed’s transactions with foreign governments, foreign central banks and other international financing organizations.”
Is it really a state secret what price the Fed paid on treasuries during their open market operations? Would it have been collapse of the Western hemisphere if which banks got loans was disclosed? We have real state secrets. Military secrets. Secrets that are designed to protect us from real people. The CIA and the Pentagon are able to operate with oversight committees. Shouldn’t the Fed have to ask special permission to keep documents or activities sealed? We have a need to know. Sure, there are some things that shouldn’t be available to everyone. It isn’t a black or white issue and we can argue over which side we err on, but there are procedures. How can it possibly be up to the Fed to determine what level of disclosure is necessary? How long should things be withheld. We have far bigger state secrets (I’m sure) than that ABC bank was going to fail if they didn’t get money and XYZ bank took advantage of the programs to make a few extra billion. Everything should be disclosed, it is our “fiat” money after all.
Fed Ownership
The fact that the Fed is technically owned by the banks is also a bit weird. Why is that necessary? Is there any reason for it? Does it really have no influence?
Fed As A Regulator
When was the last Fed Regulatory press conference held? The NY Fed has articles in the NY times about their open market purchase group and the level of “ahem” sophistication. How many regulators are there? If we could calculate a ratio of derivative notional outstanding per regulators assigned, how hideous would that number be? Don’t they have any responsibility for regulating? Where is the accountability? The banking system effectively collapsed under the existing regime’s watch, and the chairman and virtually every single board member is still there, or retired of their own volition. How is that possible? How can the NY Fed with all the banks still be there? The California Fed head with all the mortgage fiascos?
Which Fed member didn’t take the time to figure out why all the “risk” in his system was being pumped into AIG?
What is the Chicago member doing? Almost 4 years after Bear Stearns and we have to go to a DTCC website to get any information on CDS notionals? Where is clearing, let alone exchanges?
Why Not Have Limits?
Traders have limits. It is a key part of the job. You are expected to trade and make money but you need to know what your limits are. These include what products you can commit to, notional limits, DV01 limits, etc. They are meant to be large enough to handle the day to day business you run. You can usually get limit increases from your direct supervisor who has his own limits to allocate. If an occasional exceptional opportunity comes up that tends to be a fairly easy process. If you continually bump into your limits, you can ask for a bigger increase. Once in awhile something rare happens and the limits have to be approved at a higher level. That trader considers himself independent but is subject to limits.
Why can’t the Fed have certain limits, and beyond those, they have to go to Congress? Say $1 trillion of balance sheet. Is that normally enough? Sure. Under most circumstances that would be enough. The Fed would be independent though technically “limited”. If they need more, and times like this may call for more, it should be approved by the people or the representatives of the people. That isn’t too much too ask. The Fed is not slave to congress in “normal” times, but neither do they have unlimited powers.
Accountability
Authority and Responsibility go hand in hand. One without the other invariably leads to disaster. That’s is why the US government is based on the principle of checks and balances. The President/Administrative branch cannot unilaterally make policy decisions except as has been authorized by the Constitution and Congress. To pass a Healthcare bill or change the tax structure, the President has to go to Congress and persuade/negotiate/compromise. And the Congress holds the purse strings. Nor can the Congress do things unilaterally, the President must agree or the Congress must have the unity to override the veto. The Judicial Branch is independent of the President and Congress, but if the Congress/President can pass a law overriding the decision of the Supreme Court. The key is information and ability to make corrections. Checks and balances all the way.
Why is the Fed not subject to the same principles? Congress has no purse strings over the Fed; the President has no voice past the appointment (and given the 14 year terms that can be served once, that’s not much a lever). The Fed doesn’t have to reveal what it has done, thus making it impossible to make corrections. The President can be impeached for "treason, bribery, or other high crimes and misdemeanors." So can other civil officers of the United States, including the Fed Chairman. The Vice President can assume the office of the President, if the President is unable to discharge the powers and duties of the Presidency. The Fed Chairman apparently could ride in a helicopter dropping $100,000 bills on the people “to further monetary policy” and it might be impossible to stop him or find out how much he is dropping and on whom.
Gods of the World
Tuesday, December 06, 2011
Tuesday, November 22, 2011


Saturday, November 19, 2011
Since now its getting all the way to occupy NYC subway stations...
And yes, if the people really understood the real issues in America, they should get the hell out of NYC, use their brains to think a little and go occupy Washington instead...
Tuesday, November 08, 2011

Where Does The Greek Bailout Money Go?
Zerohedge: Greece is about to get an installment of 8 billion Euro. I'm going to assume that is their quarterly installment.
Greece is running a primary deficit of about 6 billion Euro (as best as I can figure out). So that is 1.5 billion per quarter. So about 19 cents of every Euro of bailout money makes it way to fund Greece's current overspending.
As best as we can tell, Greek banks hold about 75 billion of debt and other Greek entities hold about 25 billion, bringing the total to 100 billion. Assuming about 350 billion in total debt (again somewhere in the ballpark), that means about 23 cents go to Greek entities as debt service. That number is a bit misleading, as much of this has been pledged to the ECB for funding, so although it supports the Greek banks, it also goes to the ECB.
The ECB holds 55 billion of Greek bonds directly. So 18 cents of every Euro of the bailout goes to the ECB.
The "market" and "bilateral loans" total about 175 billion from what we could find. This is a bit lower than the 205 billion the IIF is talking about, but seems in the right ballpark. So about 40 cents of every Euro of the bailout is used to service debt held by non Greek banks and financial institutions.
We didn't look at the specific maturities, and just used averages. To the extent Greek pension funds for example, hold longer dated maturities, less of the money is really going to them, but for now have assumed that each group holds a similarly balanced portfolio.
We also haven't figured out about the 90 billion of derivative exposures Greece has and whether any bailout money is being used to pay on those.
In the end less than 19 cents of the bailout are going to allow Greece to continue its overspending. About 23 cents goes to Greek institutions, though at this point, all of that is held by the ECB, so it is not fully benefiting Greece.
18 cents are going to the ECB directly and 40 cents are going to banks and insurance companies outside of Greece. So at least 58 cents of every bailout Euro is going outside of Greece, and depending on how you treat the repo agreements, that number could easily be 70 cents.

So yes, Greece is getting a bailout, but you can see why Merkozy got so scared at the idea of a referendum. The bulk of the money that Greece is "getting" comes right back to the rest of the EU. Whatever posturing is going on, Greece will get away without meeting any of its stated goals, or at least it will until the EU decides it has written down enough principal and that the ECB can handle the shock.
This is our first attempt at breaking down where the bailout money really goes. We have made a lot of assumptions and found data that seems sketchy at best, but will work on fixing any mistakes. We do think it is an interesting way to look at it, and confirms who really has the problem with a Greek default - and it's not Greece.
Greece is running a primary deficit of about 6 billion Euro (as best as I can figure out). So that is 1.5 billion per quarter. So about 19 cents of every Euro of bailout money makes it way to fund Greece's current overspending.
As best as we can tell, Greek banks hold about 75 billion of debt and other Greek entities hold about 25 billion, bringing the total to 100 billion. Assuming about 350 billion in total debt (again somewhere in the ballpark), that means about 23 cents go to Greek entities as debt service. That number is a bit misleading, as much of this has been pledged to the ECB for funding, so although it supports the Greek banks, it also goes to the ECB.
The ECB holds 55 billion of Greek bonds directly. So 18 cents of every Euro of the bailout goes to the ECB.
The "market" and "bilateral loans" total about 175 billion from what we could find. This is a bit lower than the 205 billion the IIF is talking about, but seems in the right ballpark. So about 40 cents of every Euro of the bailout is used to service debt held by non Greek banks and financial institutions.
We didn't look at the specific maturities, and just used averages. To the extent Greek pension funds for example, hold longer dated maturities, less of the money is really going to them, but for now have assumed that each group holds a similarly balanced portfolio.
We also haven't figured out about the 90 billion of derivative exposures Greece has and whether any bailout money is being used to pay on those.
In the end less than 19 cents of the bailout are going to allow Greece to continue its overspending. About 23 cents goes to Greek institutions, though at this point, all of that is held by the ECB, so it is not fully benefiting Greece.
18 cents are going to the ECB directly and 40 cents are going to banks and insurance companies outside of Greece. So at least 58 cents of every bailout Euro is going outside of Greece, and depending on how you treat the repo agreements, that number could easily be 70 cents.
So yes, Greece is getting a bailout, but you can see why Merkozy got so scared at the idea of a referendum. The bulk of the money that Greece is "getting" comes right back to the rest of the EU. Whatever posturing is going on, Greece will get away without meeting any of its stated goals, or at least it will until the EU decides it has written down enough principal and that the ECB can handle the shock.
This is our first attempt at breaking down where the bailout money really goes. We have made a lot of assumptions and found data that seems sketchy at best, but will work on fixing any mistakes. We do think it is an interesting way to look at it, and confirms who really has the problem with a Greek default - and it's not Greece.
Thursday, November 03, 2011
G-20 Will Ask IMF To Print Reserve Currency??
ZeroHedge: Four months ago we predicted that in response to the latest round of global economic deterioration, every central bank would very soon join the toner party. Since then we have seen the Fed commence Operation Twist and telegraph another episode of MBS asset purchases; a new QE episode at the Bank of England; a new round of covered bond purchases at the ECB, coupled with an interest rate cut by its latest Goldman Sachs-based president, not to mention the persistent attempts to generate a backstop central bank in the form the EFSF Frankenstein Swiss Army knife; a new round of asset purchases and a massive, several hundred billion snap FX intervention by the Bank of Japan; and last but not least, that stalwart of stability, the Swiss National Bank, went ahead and destroyed the Swiss Franc as the sanest among the fiats by pegging it to that most unstable of currencies, the Euro. In light of the above how gold is not trading north of $2000 is still beyond us, although whether by manipulation or market inefficiency, we can not complain: it is easier to buy gold at $1,750 than at $7,150. Yet not even we could possibly predict just how far the global ponzi cartel would fall to extend the status quo by a few extra months. Because according to Dow Jones, the latest and greatest purchaser of Heidelberg Mainstream 80 machines will be the, drum roll, the IMF! Yes, the same organization that DSK swore would never join the global central banking stupidity, since deposed with a false allegation, and now headed by the woman who brought France to the brink of ruin, will be the marginal printer, now that everyone else is "dodecatuple all in" and sitting all day on the Turbo Print button.
Super Mario Enters the Ring
Zerohedge: Today marks the beginning of a new era for the ECB, with Mario Draghi taking over the helm from Jean-Claude Trichet as the President of the central bank. Unfortunately for Draghi, the changeover is to take place at a very critical juncture and at a time when market participants are demanding that the central bank takes more pro-active measures to stimulate the stagnating economy which stands on the brink of a double dip recession. However, such action may prove difficult for Draghi to push through the governing council since doing so only few months after Trichet announced that the central bank is to resume covered bond buying and 12-month LTROs risks undermining the central banks’ credibility. Another reason why a rate cut may prove futile is that the meeting coincides with the G-20 summit where leaders of the Eurozone are expected to endorse use of the leveraged EFSF fund as an investment opportunity for countries with a large budget surplus such as China and other BRICS. In turn this indicates that comments stemming from the summit may have a more profound impact on investors’ appetite for the EU related financial instruments and therefore determine whether the EUR/USD pair consolidates above the 1.4000 level.
As such, it looks more likely that the ECB will remain committed to further purchases of various EU bonds via the SMP program until lawmakers in Europe agree on finer details regarding the implementation of the recently proposed leveraged EFSF. This move will be particularly welcomed since the bond yield spread between the German 10-year and Italian 10-year BTP is trading back at record wide levels in spite of Berlusconi’s government introducing further austerity measures to meet the proposed deficit reduction levels. Nevertheless, given that the ECB does not pre-commit to future policy manoeuvre suggests that Draghi may leave the door open for a rate cut later in December should the economic conditions deteriorate further.
Elsewhere, policymakers will remain mindful of the recent controversy stirred by the Greek PM Papandreou after he called for a referendum on measures agreed by the EU leaders to tackle the Greek debt situation in a recent summit. The uncertainty caused by the announcement may prompt the ECB to refrain from further easing until the situation settles down. However, the Central Bank may need to continue with its stance of providing ample liquidity as well as continue buying Eurozone government bonds to micro-manage soaring bond-yields. If the latter is to be the case, Bunds will likely come under pressure and we may observe tightening of the Eurozone 10-year government bond yield spreads, while EUR may also receive support. Finally, ongoing volatility in Eurozone bank shares may guide the ECB to relax collateral rules and market participants will also watch keenly any comments pertaining to ECB’s USD-liquidity operations.
Tuesday, October 25, 2011
16 things that the people will never see again in Libya
Since we have officially helped Al-Qaeda take over Libya and with National Transitional Council leader Mustafa Abdul-Jalil’s announcement that Libya would follow Sharia law, here are 16 things that the people will never see again:
1. There is no electricity bill in Libya; electricity is free for all its citizens.
2. There is no interest on loans, banks in Libya are state-owned and loans given to all its citizens at zero percent interest by law.
3. Having a home considered a human right in Libya.
4. All newlyweds in Libya receive $60,000 dinar (U.S.$50,000) by the government to buy their first apartment so to help start up the family.
5. Education and medical treatments are free in Libya. Before Gaddafi only 25 percent of Libyans were literate. Today, the figure is 83 percent.
6. Should Libyans want to take up farming career, they would receive farming land, a farming house, equipments, seeds and livestock to kickstart their farms are all for free.
7. If Libyans cannot find the education or medical facilities they need, the government funds them to go abroad, for it is not only paid for, but they get a U.S.$2,300/month for accommodation and car allowance.
8. If a Libyan buys a car, the government subsidizes 50 percent of the price.
9. The price of petrol in Libya is $0.14 per liter.
10. Libya has no external debt and its reserves amounting to $150 billion are now frozen globally.
11. If a Libyan is unable to get employment after graduation the state would pay the average salary of the profession, as if he or she is employed, until employment is found.
12. A portion of every Libyan oil sale is credited directly to the bank accounts of all Libyan citizens.
13. A mother who gives birth to a child receive U.S.$5,000.
14. 40 loaves of bread in Libya costs $0.15.
15. 25 percent of Libyans have a university degree.
16. Gaddafi carried out the world’s largest irrigation project, known as the Great Manmade River project, to make water readily available throughout the desert country.
Thursday, October 20, 2011
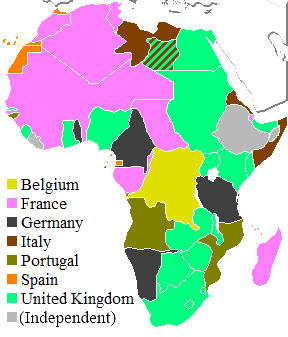
Colonization of africa part II
Since Gaddafi was first in Africa to be taken out by the Westerner this decade due to his oil and $$$, whos next? Here is a map from the 1914 and the list of the dictators today...

Friday, October 14, 2011
Bill Gross Tells Clients 2011 a ‘Stinker’, thats what happens when you jump the gun on a trade!
Here is a article from Bloomberg, so, Bill Gross, doesn't it suck that sometimes, no matter how right you are on fundamentals, your trade may not work.. Even Bill Gross, all his theories were right, but he just forgot one factor that caused him to trail behind this year: FEAR! Like they always teach in trend following: who cares about the fundamentals, it goes up you long, it goes down you short. There is a reason to this saying Mr Gross....
Bill Gross, manager of the world’s biggest mutual fund, told clients he misjudged the extent of the economic slowdown in developed economies, causing his Pimco Total Return Fund to trail rivals this year.
“This year is a stinker,” Gross wrote in a letter to clients entitled “mea culpa,” a copy of which was posted by Dealbreaker.com. “There is no ‘quit’ in me or anyone else on the PIMCO premises. The early morning and even midnight hours have gone up, not down, to match the increasing complexity of the global financial markets.”
Gross’s $242.2 billion Total Return Fund has returned 1.3 percent this year, lagging behind 82 percent of peers, Bloomberg data show. That’s his worst performance relative to rivals since at least 1995, the earliest year for which Bloomberg has rankings for Pimco’s flagship. Gross shunned Treasuries in the first half of the year, missing a rally as investors rushed to the safety of government-backed debt amid the European sovereign-debt crisis.
“As Europe’s crisis and the U.S. debt ceiling debacle turned developed economies towards a potential recession, the Total Return Fund had too little risk off and too much risk on,” Gross wrote.
Gross, who is co-chief investment officer at Pacific Investment Management Co. in Newport Beach, California, wrote that Pimco’s economic growth forecast for developed markets, under a scenario it termed the “new normal,” was too optimistic. The firm has revised its forecast for developed economies to zero, according to Gross.
Over the past five years, Pimco Total Return has returned 7.8 percent, beating 97 percent of its rivals, Bloomberg data show.
Thursday, October 13, 2011
Just my 2 cents on the Montreal housing market
This is not really relevant to the blog, but since I always talk about how we are soon going to see a housing price correction for Canada, especially in Montreal, here is a short article:
Price levels alone don’t tell us if valuation in a particular area is high, or at risk of a substantial correction. Other factors such as average incomes in the area need to be considered. Let’s look, then, at the most recent RBC Housing Affordability Measures report.
For a standard two-storey house in Canada, home ownership costs (including mortgage payments, utilities and property taxes) take 46.2% of a household’s pre-tax income. The average since 1985 is 43.7%. Bankers historically have preferred homeownership costs to be lower than 40% of gross monthly income.
In Vancouver, the RBC affordability index stands at 77.8% (compared to the historical average of 62.9%). Next come Toronto (56.6%), Montreal (51.6%), Ottawa (40.5%) and Calgary (37.0%).
Toronto is only 3 percentage points above its historical average while Montreal is 10 points above. Ottawa is fractionally higher, while Calgary is actually 4 percentage points lower. The Maritimes, Manitoba and Saskatchewan have affordability readings from 37% to 40%, not far from their long-term averages.
Vancouver clearly raises some concerns. Indeed, the Demographia International Household Affordability Survey ranks the city the third least affordable in the world. To a lesser extent, Montreal poses a few worries. Toronto may have some of the highest houses prices in Canada but they aren’t too far out of line in relation to income levels. Ottawa looks even less risky, and Calgary -- although its average price level is relatively high -- is not only one of the most affordable the RBC survey but also showing the most improvement.
Risk can also be assessed by the ratio of house prices to household incomes, which removes the impact of mortgage rates. As mortgage rates are currently quite low and likely to revert to higher levels, price-to-income ratios provide another perspective on risk levels.
A look at the Greek Math...
- The Greek January – September budget deficit was EUR 19.16bn versus 16.65bn same period last year (+15%). This only includes the central government.
- The initial deficit target for 2011 was EUR 17bn. We blew past that after only 8 months. The revised target (July) is now 22bn (9.5% of GDP).
- Latest estimate from the Greek government: 8.5% deficit (19.5bn) for 2011 (instead of 7.6% or 17bn).
- While 2011 revenues are trending below 2010, expenses are trending higher.
- Despite all the austerity measures, Greece is still spending 150% of its revenues.
- Of course, the Ministry of Finance sees a reduction of the deficit to a miniscule 2.6% of GDP by 2014 as revenues rise and expenses come down.
- How is that possible? Somehow, after spending four consecutive years in recession (2009-2012), the economy will rise like a phoenix and grow by 5.8% in 2014.
PBOC Launches Day Two Of Currency Cold War Offensive
Zerohedge: The People's Bank of China set the yuan's central parity rate against the U.S. dollar at 6.3737 on Thursday, a second sequential major drop and down from Wednesday's 6.3598. This follows a weakened fixing of 6.3598 on Wednesday, down from the record high fixing of 6.3483 on Tuesday, just before the Senate decided to launch the first salvo in the Sino-US trade wars. Surely news of the collapse in Chinese exports will merely reinforce the theme that the USDCNY is in sudden need of devaluation and be a loud slap in the face of the Senate which will now come face to face with its utter worthlessness. In Hong Kong, the offshore yuan spot rate was fixed at 6.4407 against the greenback on Thursday, compared with Wednesday's 6.4923. The fixing is based on an average of bids from 15 participating banks and is calculated by the Treasury Markets Association, a Hong Kong-based industry group. We are hardly the only ones who noticed the escalation in spot USDCNY wars by the PBOC, which now appears hell bent on showing the US its peg can go lower in addition to higher (inflationary consequences be damned) - from the WSJ: "The yuan fell sharply against the U.S. dollar in early Thursday trade, after the Chinese central bank surprised the market by guiding its currency weaker for the second consecutive day despite the dollar's global weakness." So even as the USD is plunging against the hope-driven Euro, which has soared 600 pips in the past week on nothing, the USD is now jumping against the CNY for no other reason than mere demagogic policy. And this environment in which central bank decisions are all that matter is the one in which traders hope to make a living based on rational market decisions (as otherwise one can flip a coin in Vegas)? Good luck.
Saturday, August 13, 2011
The Fix Is In ... Peter Schiff
Here is a very goodcomment made by one of my favorites, Peter Schiff, about the Fed's policy to hold rates at 0% for the next two year ( of how low interest rates really just destroys the economy):
Many economists have short-sightedly concluded that ultra low interest rates are a sure fire way to spur economic growth. The easier and cheaper it is to borrow, they argue, the more likely business and consumers are to spend. And because spending spurs growth, in their calculation, low rates are always good. But, as is typical, they have it backwards.
I believe that ultra-low interest rates are among the biggest impediments currently preventing genuine economic growth in the US economy. By committing to keep them near zero for the next two years, the Fed has actually lengthened the time Americans will now have to wait before a real recovery begins. Low rates are the root cause of the misallocation of resources that define the modern American economy. As a direct result, Americans borrow, consume, and speculate too much, while we save, produce, and invest too little...............
It was bad enough that the Fed held rates far too low, but at least a fig leaf of uncertainty kept the most brazen speculators in partial paralysis. But by specifically telegraphing policy, the Fed has now given cover to the most parasitic elements of the financial sector to undertake transactions that offer no economic benefit to the nation. Specifically, it will simply encourage banks to borrow money at zero percent from the Fed, and then use significant leverage to buy low yielding treasuries at 2 to 4 percent. The result is a banker's dream: guaranteed low risk profit. In other words it will encourage banks to lend to the government, which already borrows too much, and not lend to private borrowers, whose activity could actually benefit the economy.
This reckless policy, designed to facilitate government spending and appease Wall Street financiers, will continue to starve Main Street of the capital it needs to make real productivity-enhancing investments. American investment capital will continue to flow abroad, denying local business the means to expand and hire. It also destroys interest rates paid to holders of bank savings deposits which traditionally had been a financial pillar of retirees. In addition, such an inflationary policy drives real wages lower, robbing Americans of their purchasing power. The consequence is a dollar in free-fall, dragging down with it the standard of living of average Americans.
Friday, August 12, 2011

Tuesday, August 09, 2011
A Look At How $58 Billion In USD Purchases Buys You 4 Days Of FX Intervention
From zerohedge, It was just 4 days ago that the BOJ purchased Y4.5 trillion (or $58 billion) worth of dollars in the open market to lower the Yen against the dollar. Well, that intervention last not even a full 4 days. As the chart below shows it is time for Shirakawa and Noda to start watching... watching... watching... the yen as it once again approaches all time highs against the dollar. But at least the equity market is confused enough to believe that 2 years of projected deflation is good for risk. Ben wins.... if only for a few hours. The irony is that everyone expected that a fixed inflation (or in this deflation) calendar language is the weakest of the Fed's options. Now that this is precisely what has been utilized, a soft form of Operation Twist 2 which locks in the rates on the 2 Years as explained previously, the market is cheering it deliriously. Once the market has slept on it, it will likely realize why it was so skeptical as recently as 2 hours ago on the viability of this approach.


Are you serious? Look at the 3 year auction today...
Wow, 32$ billion with high yield of 0.5%? Say goodbye to your equity market. I'm telling you, when the bond market reverses, it will be a horrible scene....

While we are at it, as my boss Joe mentioned, take a look at the CAD interest rate curve, rate cutes from 1%, really? Should someone put a trade before this thing flattens out?

Market crash 2011... Don't say I didn't tell you so...
Well since the markets has recently confirmed my view in June and is heading to the Dow 10000 level that I predicted, Im going to post on this blog a part of my QE3 publication that I wrote at the end of June. Even though I was wrong on the treasury call, I was definitly good on the equity trade. Here it is:
We all know QE2 completely bombed, everything the program was supposed to accomplish failed, money are moved from the FED into risky asset, equity markets gets inflated and huge pile of cash goes into speculation that leads to commodity inflation which in turns adds pressure and slows down the economy. While all the cash is getting piled in to give LinkedIn a ridiculous valuation of 10$ billion at the first day of trading (which sales is only at 250$M), none of the money moved into the economy and nothing work! Just look at all the economic numbers! By the way, and its not that banks are unwilling to lend out their reserve from QE2 to small businesses, far importantly, the problem is that they are unable to. You know why? Because all of the actual QE2’s liquidity went to the rescue of foreign banks! Ask big Ben Bernanke and he will explain that to you.
So, is Bill Gross right? I think so. And if we do see QE3, what will happen in my point of view? Stagflation. Let me remind you of the Japanese Economy after their failure of their QE in early 2000. Decades of deflation, 13$USD Trillion in debt, debt to GBP of 200%, 2 year yields at 0.1% and here is a Nikkei 225 historical chart to better paint your memory (chart below). You can't cover a huge wound with a band aid, all it does is it delays the problem. One band aid (QE) after another, eventually, if you don't stitch the wound ( increase taxes, increase saving, balancing budget) it will just get worst and infected as you keep covering it up with more band aid. Stiching the wound will be painful for the whole country, but its the right thing to do, or else, eventually, you will bleed to death. SoUS

So as we approach the end of June in a couple of days, the Fed’s QE2 600$ Billion purchase program is coming to the end but we just had the 10 year yields breaking below 3% again today with the help of a 1 trillion $ US equity market correction in the first 2 week of June. This begs the question, is Bill Gross right with his call to underweight US
We all know QE2 completely bombed, everything the program was supposed to accomplish failed, money are moved from the FED into risky asset, equity markets gets inflated and huge pile of cash goes into speculation that leads to commodity inflation which in turns adds pressure and slows down the economy. While all the cash is getting piled in to give LinkedIn a ridiculous valuation of 10$ billion at the first day of trading (which sales is only at 250$M), none of the money moved into the economy and nothing work! Just look at all the economic numbers! By the way, and its not that banks are unwilling to lend out their reserve from QE2 to small businesses, far importantly, the problem is that they are unable to. You know why? Because all of the actual QE2’s liquidity went to the rescue of foreign banks! Ask big Ben Bernanke and he will explain that to you.
So, is Bill Gross right? I think so. And if we do see QE3, what will happen in my point of view? Stagflation. Let me remind you of the Japanese Economy after their failure of their QE in early 2000. Decades of deflation, 13$USD Trillion in debt, debt to GBP of 200%, 2 year yields at 0.1% and here is a Nikkei 225 historical chart to better paint your memory (chart below). You can't cover a huge wound with a band aid, all it does is it delays the problem. One band aid (QE) after another, eventually, if you don't stitch the wound ( increase taxes, increase saving, balancing budget) it will just get worst and infected as you keep covering it up with more band aid. Stiching the wound will be painful for the whole country, but its the right thing to do, or else, eventually, you will bleed to death. So

Monday, August 08, 2011
Im back....Since S&P is doing the useless downgrading anways...
Here, since I am currently preparing to write about how the power of the world is about to shift from a single dominant power back to a system of balance of power (like in Europe for the past centuries), here are two interesting charts, one on global arms exports and the other comparing the military power of China and the US.


By the way, like I called it, we should see the US market dip ( I called Dow 12000 the shorting point and those of you that listened, you are well in the money with shorting the YM futures, but please, keep riding this trend and slam the whole thing down, we don't get much of these opportunities) and there will be no QE3 package in the US as it is a suicide pill that will take the country into stagflation if it doesn't work. Uncle Ben is a student of the great depression and he understands the consequences of failure. He knows how painful the lost decade was for the Japanese and he won't risk the US economy into the same black hole. ECB is the only one that can push though a QE1 for them and we are seeing it as they are starting to pick up all the EU bonds in the secondary markets these days.
And the S&P downgrade, what kind of BS is this anyways? Its not like we don't know the US's balance sheet is crap, we know this for decades. There is 14Trilion of debt and like 70 Trillion of unfunded liabilities, we all know that, its not a secret. Why a downgrade all of a sudden? Its so useless! They have the currency reserve, as long as they keep it, it doesn't matter what your downgrade is, even at BBB, the 10 years still trade below 2.7%, so what a bunch of non sense...
Tuesday, June 21, 2011
Goldman Sachs, the story of the survival of the fittess...
Its been a while since I last wrote an article about credit derivatives so here, this article is for all you quant nerds....lol... Well, let me begin with two random quotes from Goldman's management during 2007 right around the time when the ABX BBB index faced an initial decline in December 2006:
" Sell what could be sold as is, repackage and sell everything else " - Keven Gasvoda, MD, Goldman's Fixed income, Currency and Commodities.
"We have been thinking collectively as a group about how to help move some of the risk. While we have made great process moving the tail risks, we think it is critical to focus on the mezz risk that has been built up...the best target, would be to put them in other CDOs"- Stacy Bash Polley, Co Head of Fixed Income Sales.
Goldman had it all figured out before anyone else even had a clue what was going on. Goldman is smart, the team is damn smart. They are the king of repackaging, from MBS to a CDO, from a CDO to CDO squared, they are the best, thats it! In 2010, after getting nailed with a 550$ million settlement for the Abacus synthetic CDO deal involving Paulson (who actually just lost 750$ million today by dumping all his share of Sino Forest, its his turn to get screwed this time) we have here a post by William Cohan about the credit derivative business at Goldman Sachs:
Well here you go, so whoever that wants to argue with me in regards to why Goldman is the best in the business, give me a call.. I'll be more than glad to. And to sum up, here is a diagram of the famous Abacus AC1 Syntheic CDO deal, talk about confusing the hell out of everyone....
![]()
" Sell what could be sold as is, repackage and sell everything else " - Keven Gasvoda, MD, Goldman's Fixed income, Currency and Commodities.
"We have been thinking collectively as a group about how to help move some of the risk. While we have made great process moving the tail risks, we think it is critical to focus on the mezz risk that has been built up...the best target, would be to put them in other CDOs"- Stacy Bash Polley, Co Head of Fixed Income Sales.
Goldman had it all figured out before anyone else even had a clue what was going on. Goldman is smart, the team is damn smart. They are the king of repackaging, from MBS to a CDO, from a CDO to CDO squared, they are the best, thats it! In 2010, after getting nailed with a 550$ million settlement for the Abacus synthetic CDO deal involving Paulson (who actually just lost 750$ million today by dumping all his share of Sino Forest, its his turn to get screwed this time) we have here a post by William Cohan about the credit derivative business at Goldman Sachs:
"Goldman's business model is designed around the exploitation of secrecy. Secrecy is organizing principle that governs modern credit markets. Credit default swaps, privately placed structured securitizations (e.g. CDOs), and hedge funds have all flourished-- they dominate the debt markets--because they are all designed to exploit secrecy. They all create extraordinary profits by keeping the rest of us in the dark. So in late 2006, if you wanted to find out what was happening in this newly created synthetic RMBS market, you couldn't find out much of anything. You couldn't find out anything about who bought or sold any CDO, or what was in any CDO, or how any CDO performed, unless Goldman or some other CDO underwriter deemed you sufficiently worthy of their selective disclosures. You couldn't learn anything from the sales or trading activity of mortgage bonds, because the related trading in credit default swaps was kept hidden beneath the surface. You didn't know anything about the trading activity related to the ABX indices, since that, also, was kept secret. And since the privately-held company that owned the ABX, CDS IndexCo LLC, operated in total secrecy, and since the privately-held company that published the price of the ABX, Markit Group Limited , operated in total secrecy, you had no way of knowing the extent to which the price of the ABX was manipulated through round-tripping, side deals with synthetic CDOs, or anything else. The only thing you knew, your only link to the illusory "reality " of market sentiment, was the quoted price of the ABX. And you might happen to know that the Chairman of CDS IndexCo was Brad Levy, a managing director at Goldman, which, along with a handful of other banks, controlled CDS IndexCo and Markit Group. Both the FCIC and the Levin subcommittee disclosed a wealth of information that others with a more skeptical bent can scrutinize in depth. This information poses a direct challenge to Goldman's dissembling, and to the moral hazard of access journalism, which is no substitute for the full transparency of a free and open marketplace of ideas. "
Well here you go, so whoever that wants to argue with me in regards to why Goldman is the best in the business, give me a call.. I'll be more than glad to. And to sum up, here is a diagram of the famous Abacus AC1 Syntheic CDO deal, talk about confusing the hell out of everyone....

Friday, June 17, 2011
Morgan's call on a 7s-10s DV01 flattner by Jim Caron
Here is a very good article from Zero Hedge for those of you that follow and trade the interest rates markets. FYI, I think that this 7s 10s flattener is a good relative trade idea since its better than going direct short on the 10s , but Caron's reason of trade ( economic growth ) vs Bill Gross's claim ( lack of Fed buying at the end of QE2) is completly INSANEEEEE. Anyways, here is the article...
It has not been Jim Caron's decade. The Morgan Stanley rates strategist, riding on the coattails of the always wrong Morgan Stanley economics team led by David Greenlaw, has been wrong in his annual rates call year after year after year. Which is unfortunate because while unable to see the forest for the trees, Caron does have a better grasp of rates than most other Wall Street penguins. That said, just like everyone else in the status quo, Caron has just come out with another short duration call (i.e. sell bonds), probably the 6th time in a row he has done that in the past 3 years. Perhaps 7th time will be the charm. Amusingly, Caron, terrified to be seen in the same camp as Bill Gross who is short bonds on fears that there will be nobody available to step in an buy the 80% of gross issuance that has been monetized by the Fed to date, make this very loud caveat on his short bond call: "To be sure, our shift toward short from neutral duration has nothing to do with the end of QE2 and related concerns that there will be a lack of demand to buy US Treasuries once the Fed stops buying them. As we have stated many times in the past, the outlook for the economy will be the main driver of yields, not the end of QE2." No, instead Caron believes that the sell off in bonds will be due to the same bullish economic growth call that he has been predicting over... and over... and over... and over... etc. More interesting is how he suggests the trade is implemented: in MS' view the best way to be bearish on rates is with a DV01 neutral 7s-10s flattener: "we continue to recommend being short 5s on the 2s5s10s fly. In line with the butterfly, and in order to express a more robust short duration position, we recommend a curve flattener on the UST 7s10s curve: · Sell $133.7mm OTR 7y Notes; · Buy $100mm OTR 10y Notes." Perhaps those who want to be short bonds, but for the right reason, that predicted by Zero Hedge and then Bill Gross, this may be one of the better ways to put the trade on.
And the best way to express a bearish stance in the rates complex according to Caron:
Since April, the belly of the curve has richened significantly as rates have marched lower (Exhibit 1). We continue to recommend being short the belly vs. the wings, as previously discussed short 5s on the 2s5s10s fly (see “Fade the Recent Outperformance of the Belly,” US Interest Rate Strategist, June 9, 2011). In line with the butterfly, and in order to express a more robust short duration position, we recommend a curve flattener on the UST 7s10s curve:
· Sell $133.7mm OTR 7y Notes
· Buy $100mm OTR 10y Notes
Both the 7s10s curve flattener and the butterfly allow the investor to play for a reversion in the richness of the belly. Rather than going outright short we suggest initiating these relative value trades, which capture some duration exposure and some relative value exposure between different points on the curve.
We argue that growth expectations have not been downgraded to the extent that rates in the 5-10y sector have fallen with survey consensus at 3.35% for 2H11. In our view, the rates market is pricing levels of US growth that are inconsistent with surveyed forecasts (see “Reducing Duration Exposure from Neutral to Underweight” in this publication).
This past week, price action in the market has reflected uncertainty as, for example, the 7y point increased 12bp on Tuesday only to decrease by 14bp on Wednesday returning to similar levels. We expect the market to remain range-bound in the near term; however, we see fair value of the 10y note at about 3.10% with a 25bp standard deviation (Exhibit 2). With the 10y dipping to the low 2.90’s, we see an opportunity to fade this extreme.

Wednesday, June 15, 2011
Fannie, Freddie, Ginnie and all about that government crap...
So, market crash in 2008, who is to blame? We've been though this one many times, some blame the shadow banking system, some blame deregulations, securitizations, other point their fingers at Greenspan while many are holding a knife at the doors of the credit rating agencies. Well, in my view, they all play a huge role but today, I want to write about the three government giants, Fannie, Freddie and Ginnie because many people don't seem to have a clue what they do and where they come from other than the fact that they deal with mortgages.
Fannie Mae was chartered by the reconstruction finance corporation during the great depression in 1938 to buy mortgages insured by the FHA. Back in the day, Fannie either held the mortgages they bought in its portfolio or they simply resold them to thrifts, banks, insurance companies or investors at a later time. The model worked fine but there was one major issue with this system. Fannie Mae, in order to buy these mortgages, they did it by borrowing the money. In 1968, the mortgage portfolio of Fannie had grown to 7.2$ billion USD and the government started to notice this issue. So in order to get the debt off the government’s balance sheet, president Johnson’s administration reorganized Fannie as a publicly traded corporation and created Ginnie Mae to take over Fannie’s subsidized mortgage program and loan portfolio and this was how Ginnie Mae was created.
Two years later, the thrifts and banks persuaded congress to charter a second GSE and Freddie Mac was created to help the thrifts sell their mortgages once again. Like we mentioned in the beginning, before 1968, Fannie Mae held the mortgages it purchased, profiting from the spread between its cost of funding and the interest paid on the mortgages. The new laws in 1970 gave Ginnie, Fannie and Freddie the option of securitization. So yes, in my point of view, the most early build up of the 2008 crisis can even start from as early as here. Therefore in 1971, Freddie got into the business of buying mortgages, pooling them and then selling MBS to investors. They did not originate mortgages, they bought them from banks and mortgage companies; either held them in the portfolio or securitized them and guaranteed them. The entire business model was changed.
The new laws in 1970 not only gave Freddie the option of securitization, but it also set the government sponsored enterprises’ minimum capital requirement at 2.5% of asset plus 0.45% of the MBS they guaranteed. Do you even know what kind of leverage this is? They could borrow more than 200$ for each dollar of capital that was used to guarantee the MBS. If they owned the securities, they could borrow 40$ for each dollar of capital. Combined, they owned or guaranteed 5.3$ Trillion USD of mortgage related assets at the end of 2007 with only 70$ Billion USD in capital! This is a leverage ratio of 75:1! Talk about risk! The Basel accord is also to blame for this! The leverage ratio of the five major investment banks in 2007 were as high as 40 to 1, and you have the government leveraging at 75 to1. Ridiculous! So now you get why these guys didn't work out! A private business with a goal to maximize shareholder equity with the backing of the government, I don't think Johnson thought this one out too well back in the 60's!
Monday, June 06, 2011
Update with the birds at the FED: SocGen

Below is a summary of recent Fedspeak:
And as a bonus, here is SocGen's current set of assumptions for the chronology of Fed exit steps:Bernanke – QE2 will be completed, but very little chance of QE3 as the trade-offs are unfavorable. Inflation expectations are still in comfort zone, but continue to watch very closely.
Pianalto – Labor market remains a long way from healthy. Looking at just above 3% GDP growth over next few years. Will take about 5 to 6 years for unemployment rate to reach NAIRU (5.5 to 6%).
Kocherlakota – Fed should raise the Fed funds rate by 50bps in 2011. Rate hikes hinge on his forecast for core inflation averaging 1.5% for rest of year. Rate hikes should be first move in exit strategy. Extended language means 2 to 4 meetings.
Lockhart – Extended period change hinges on Unemployment. Job progress slow and inflation transitory. QE3 probably unnecessary. Inflation will move to about 2% in two years.
Lacker – Inflation expectations at the upper end of the Fed’s comfort zone. Recent surge in commodity prices likely temporary. After QE2 focus shifts to timing and speed of stimulus withdrawal.
Bullard – Fed may put policy on hold to ensure economic recovery is gaining ground. Does not give judgment whether he agrees with this. US can weather recent oil price shock.
Dudley – Time to act is now. Current levels of inflation and unemployment and timeframe to return to mandate unacceptable. Showed support for price level targeting.
Evans – Believes that Fed needs to buy at a large scale several times. This would support a price level target to make up for the shortfall in Inflation. Strong support for price level targeting.
1. End of QE2 The April FOMC statement confirmed that QE2 will end on schedule, after reaching the $600bn target. This will mark the official end of the Fed’s easing cycle. When? June 2011
2. Halting MBS reinvestments Bernanke noted in its April FOMC press conference that halting MBS reinvestments will most likely occur early in the exit process. Fed will probably wait a few months following the end of QE2 to assess the impact before taking this next step. When? September 2011
3. Liquidity draining operations We believe this has to be done ahead of rate hikes, or else the effective fed funds rate will trade away from the target. The Fed could use a combination of reverse repos, term deposits and possibly restore the Supplemental Financing Program (subject to Congress increasing debt ceiling). When? November 2011
4. End of “extended” language The Fed has previously suggested that the extended language means about 6-9 months. Given the timing of our rate call, the phrase should be dropped around the turn of the year. When? December 2011
5. Rate hikes Our call is for mid-2012, with a bias toward the third quarter. When? Q3’2012
6. Asset sales We believe that outright asset sales will begin around the time of the first rate hike. Fed has indicated a goal of returning the size and composition of its securities portfolio to pre-crisis trend over 5 years. We believe they will start by selling about $10bn per month. When? Q3’2012
Tuesday, May 31, 2011
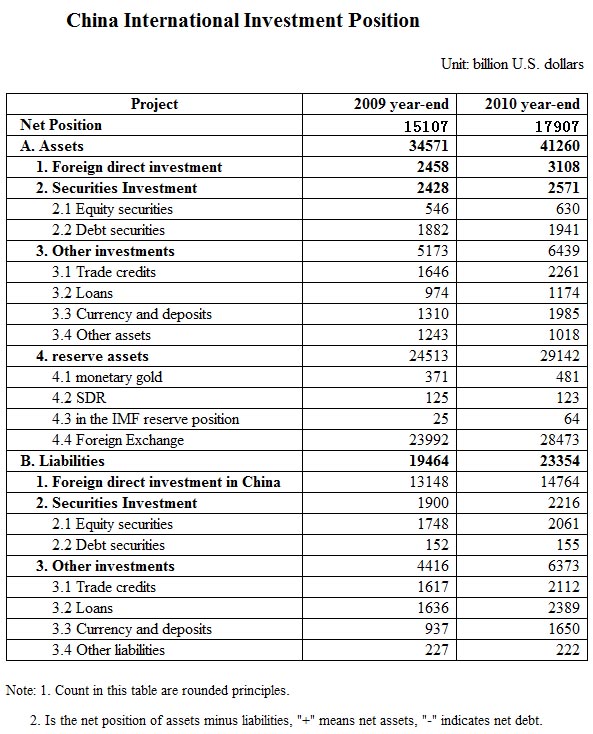
Update: China SAFE Report
From Zerohedge: China's State Administration of Foreign Exchange (SAFE) has released its breakdown of 2010 international investments. In summary: financial assets abroad rose 19% last year to $4.126 trillion from $3.457 trillion. That includes the country's $2.914 trillion of foreign reserves at the end of 2010 as well as other assets such as direct investments, securities, and gold. As for gold, it increased by $11 billion from $37.1 billion to $48.1 billion, or a 29.6% increase (it is unclear if this number is at a fixed gold price or accounts for MTM). On the liabilities side, which increased from $1.946 trillion to $2.335 trillion, the biggest change was as a result of a surge in Foreign Direct Investment into China which increased by $162 billion to $1.476 trillion. Netting liabilities against assets leads to a net position of $1.79 trillion in external net assets.
Full breakdown of China's foreign-held stash:

Full breakdown of China's foreign-held stash:
Wednesday, May 18, 2011
The History Of The World's "Reserve" Currency: From Ancient Greece To Today
This is probably one of the most educational article that I came across in a long time:

Probably the most interesting part of the previously discussed 174-page World Bank report on the future of world currencies, is, ironically, the part that deals with the past. In its discussion of why "Historically, one national currency has played a global role—or at most, a few national currencies", the WB analyzes the history of the "reserve" or dominant currency from ancient times, through today. It is an engrossing narrative which ebbs and flows with the rise and flow of the dominant superpower (no surprise there). The bottom line of course is whether or not the US will retain its superpower status in an increasingly multipolar (and developing-led) world. And whether it will be replaced by China...or nobody. The implications for the next reserve currency of choice are substantial.
Historically, one national currency has played a global role—or at most, a few national currencies
Historical records indicate that the silver drachma, issued by ancient Athens in the fifth century B.C.E. was likely the first currency that circulated widely outside its issuing state’s borders, followed by the gold aureus and silver denarius coins issued by Rome, even though the Athenian and Roman currencies circulated simultaneously for some time (see figure B3.1.1). The dominance of the Roman-issued coins was brought to an end as the long cycle of inflation that characterized the economy of the Roman Empire from the first century C.E. through the early fourth century led to a continuous devaluation of the Roman-issued currency, causing it to become increasingly less accepted outside the Roman Empire. Ultimately, the aureus became valued according to its weight rather than its imputed “face value,” trading more as a commodity than a currency outside the Roman Empire and making way for the Byzantine Empire’s heavy gold solidus coin to become the dominant currency in international trade in the sixth century.
By the seventh century, the Arabian dinar had partially replaced the solidus in this role, although the solidus continued to circulate internationally at a debased value (reflecting the high financing needs of the Byzantine Empire) into the 11th century. Large fiscal costs also led to a gradual devaluation of the Arabian dinar starting at the end of the 10th century.
By the 13th century, the fiorino, issued by Florence, was widely used in the Mediterranean region for commercial transactions, only to be supplanted by the ducato of Venice in the 15th century. In the 17th and 18th centuries, the dominant international currency was issued by the Netherlands, reflecting that country’s role as a leading financial and commercial power at the time. At that point, paper bills began replacing coins as the international currency of circulation, even though they were not backed by the Dutch government or any other entity under sole sovereign control.
It was only when national central banks and treasuries began holding gold as reserves, beginning in the 19th century, that bills and interest-bearing deposit claims that could be substituted for gold also began to be held as reserves. This development coincided with the rise of Great Britain as the leading exporter of manufactured goods and services and the largest importer of food and industrial raw materials. Between the early 1860s and the outbreak of World War I in 1914, some 60 percent of the world’s trade was invoiced in British pounds sterling.
As U.K. banks expanded their overseas business, propelled by innovations in communications technology such as the telegraph, the British Pound was increasingly used as a currency of denomination for commercial transactions between non-U.K. residents—that is, the pound sterling became a more international currency. This role for the pound was further enhanced by London’s emergence as the world’s leading shipper and insurer of traded goods and as a center for organized commodities markets, as well as by the growing amount of British foreign investment, of which a large share was in the form of long-term securities denominated in pounds sterling.
At the beginning of the 20th century, however, the composition of foreign exchange holdings by the world’s monetary authorities began to shift, as sterling’s share declined and the shares of the French franc and the German mark increased. The beginning of World War I in 1914 is widely viewed as signaling the end of Great Britain’s leading role in the international economy and the breakdown of economic interdependence.
Despite attempts to revive the gold exchange standard after World War I and to restore an international monetary order based on fixed exchange rates, the restored system lasted only a few years. The U.S. dollar’s use internationally as a unit of account and means of payment increased during the interwar period, particularly during the 1920s, reflecting the growing role of the U.S. economy in international trade and finance. Although gold was officially the reserve asset (and the anchor) of the international monetary system following World War II, under the Bretton Woods system of fixed exchange rates, the dollar took on the mantle of dominant international reserve currency. By the early 1970s, however, following the breakdown of the system because of its inherent Triffin dilemma, the major economies moved to implement floating exchange rates.
During the 1980s, the global economy showed indications that it was moving to a multicurrency system in which the Deutsche mark was taking on an expanded role as a key currency, both in Europe and globally. This was due to a combination of factors—low and stable German inflation; credible government policies; deep, broad, and open financial markets; and a relatively high share of differentiated manufactured exports in Germany’s trade. The introduction of the euro in 1999 and its adoption by a growing number of EU countries in the intervening years has only revived the debate about the dollar’s future role as the dominant international currency.
Monday, May 16, 2011
Chinese Bond Auctions Fail... Not one, but two?
Zerohedge today: And while the US is no longer allowed to auction off debt, in China the PBoC appears to be no longer able to auction off debt. As Business China reports, "the central bank scheduled the auction of RMB 20 billion worth of one-year treasury bonds and RMB 10 billion in six-month bonds on the country’s interbank bond market for May 13. But banks, faced with tight liquidity, only purchased RMB 11.71 billion worth of one-year bonds and RMB 9.63 billion worth of six-month bonds, the report said." In other words, there was a nearly 50% miss on the 3 month auction.
The key reason: "The reference yield of one-year treasury bonds was raised to 3.0246% from the previous issuance, while the bond yield of 182-day discounted treasury bonds was 2.91%, the paper said." It appears investors don't agree with the central planners that 3% is an appropriate rate to compensate them for surging inflation. That, and also the fact that banks suddenly have no liquidity: "Tighter liquidity was behind the under-subscription, as the central bank resumed selling three-year notes on May 12 after a hiatus of more than five months, a bank analyst who was not named was cited as saying. The central bank also raised banks’ RRRs by 0.5 percentage points on the same day, effective May 18, the fifth consecutive month its has raised RRRs this year." And so the Catch 22 emerges: the more China fights inflation through RRR or rate hikes, the lower the purchasing power of domestic banks to purchase bonds (and yes, the US deficit is just a few hundred billions dollars too wide for it to come to China's rescue). Should the "15 minute" inflationary conundrum continue to express itself, and China be forced to rise rates even longer, very soon the country, just like the US to which it is pegged monetarily, will also be unable to raise any incremental capital.
The key reason: "The reference yield of one-year treasury bonds was raised to 3.0246% from the previous issuance, while the bond yield of 182-day discounted treasury bonds was 2.91%, the paper said." It appears investors don't agree with the central planners that 3% is an appropriate rate to compensate them for surging inflation. That, and also the fact that banks suddenly have no liquidity: "Tighter liquidity was behind the under-subscription, as the central bank resumed selling three-year notes on May 12 after a hiatus of more than five months, a bank analyst who was not named was cited as saying. The central bank also raised banks’ RRRs by 0.5 percentage points on the same day, effective May 18, the fifth consecutive month its has raised RRRs this year." And so the Catch 22 emerges: the more China fights inflation through RRR or rate hikes, the lower the purchasing power of domestic banks to purchase bonds (and yes, the US deficit is just a few hundred billions dollars too wide for it to come to China's rescue). Should the "15 minute" inflationary conundrum continue to express itself, and China be forced to rise rates even longer, very soon the country, just like the US to which it is pegged monetarily, will also be unable to raise any incremental capital.
Saturday, May 14, 2011
The End of the USD Depreciation: Part II
Over the past couple of days, I received a few calls and email from some of you asking about my Yen/USD trade idea that I mentioned in my previous post, for those of you that didn't get the quarterly publication, here was the FX trade strategy that I wrote up back in April:

First off, I will start with some history and fundamentals for those of you who aren’t active in the foreign exchange market. The popularity of the USD/JPY trade has come a long way. In the 1980s, during the Carter and Reagan era, the US was going though a time of high inflation and high interest rates and the Americans were unhappy with the strength of the USD (1 USD = 260 JPY) so during the Plaza Accords, James Baker and the Japanese government agreed to let the USD freefall against the JPY. The JPY settled at around 130 JPY/USD in 1990 and this let to huge strength for the Japanese economy. Along with deregulations in the Japanese financial industry and speculation of the housing market supported by the government, the real estate bubble exploded, banks that were “too big to fail” went under and it drove the Japanese economy into the lost decade (Doesn’t that sound similar to subprime 2008 huh?). This was when the original quantitative easing tool was first applied to fight the severe recession. For over two decades, Japanese’s bond yield hovered near 0% and therefore it was very popular for traders to build carry trades with the USD/JPY pair due to the carry from the interest rate differentials.
So, what is a carry trade? In a carry trade, an investor borrows in a currency with low interest rates and re-invests in a currency with higher yield. But in 2010, due to the appreciation of the JPY (if you read my previous papers you would know why), which had a 15% gain versus the USD, those who pursued a yen based carry trade strategy suffered huge losses on their P&L. (Below is a table explaining the JPY based carry trade with the 2011 YTD return and the last 12 month’s return)

I mentioned to many of you that when the JPY broke 80 against the USD last week, the appreciation of the Japanese Yen is coming to an end, especially against the USD and EUR. Not long ago, the Japanese government intervened to depreciate the currency to support its economy, but as we all know, that didn’t last too long before the climb continued. However, this time around, it’s going to be different due to two main reasons:
- Interest rate differentials from the inflation pressure at the FED and ECB
- The reversal in trend of monetary base due to the recent earthquake.
Inflation: if we take a look at the global economic situation, central banks are facing growing pressure to tighten up monetary policy from the inflationary pressure. The CPI projection for 2011 in the US
Monetary Base: interest rate differential and the Japanese/US Monetary base ratio are two main macro factors that explain the currency movement between the two countries. While the FED expanded its balance sheet to about 2.5$USD Trillion with the two QE programs, the purchases is expected to end in June and we will most likely see the Fed reversing its actions to reduce the monetary supply in the system. Before the earthquake, the ratio of the Japanese monetary base to the US
Thursday, May 12, 2011
Dylan Grice On The Coming Japanese Hyperinflation
So here is a resume from zerohedge and a chart from one of my favorite, Dylan Grice from SocGen in his paper about his views on the upcoming Japanese Hyperinflation:
For the really ADHD afflicted, here is the "CDS trader" abridged version:

To those who follow Dylan Grice's writings closely (and everyone should), his proposal that the only possible outcome for Japan, where stunningly tax revenues no longer ever cover non-discretionary expenditures - a sad fate that awaits none other than the US eventually, is to hyperinflate its way out, is not new. Nonetheless, during the just completed annual CFA Institute annual institute held in Edinburgh, he gave an updated presentation which indicates that he has not yet changed his opinion that if forced to pick between the lesser of two defaults, the only option is that of unbridled printing, now that the US has firm leg up in the global fiat race to the currency bottom, which we predicted back in 2009, will be the key feature of the macro theme until the end of the Keynesian experiment. So, as before, Grice's recommendation, away from the natural trade of shorting bonds (a negative carry trade which has cost the likes of Kyle Bass a pretty penny over the years) as one awaits this only possible outcome, is to actually discount the future, something the market has completely forgotten how to do, and buy stocks, in advance of the Weimar Rally for the Rising Sun. Below we present "Hoping for the best, preparing for the worst...in Japan" - Grice's presentation of an upcoming Japanese hyperinflation, which explains not only why Japan can't afford higher JGB yields, but why its to-date favorable demographic are now looking uglier by the day, and the only outcome for Shirakawa is to finally bite the bullet and beat the Chairsatan at his own game, in the process forcing the Bernank's own hand if he wishes to retain the USD's place at the head of the FX devaluation race.
- Japan’s unprecedented predicament: A large creditor nation, a bankrupt government, and a shrinking population
- Competing forces in the hyperinflation template: An unsustainable public debt profile with persistent current account surpluses
- Protecting portfolios: How investors can cheaply hedge against the risk of an extreme scenario
CHART 1: Japanese government tax revenues no longer cover discretionary expenditure:
Tuesday, May 10, 2011
So, is this going to be the end of the USD depreciation?
Well here are 2 charts posted by Bloomberg today. If you read my articles in April about the USD/YEN trade recommendation, you'll know what I am talking about...


Monday, May 02, 2011
Treasury Cuts Its Borrowing Need Estimate By Half, To Suspend State, Local Gov't Funding Due To Upcoming Debt Ceiling Breach
Here is a pretty interesting article posted by zerohedge today: After announcing it issued $265 billion in marketable debt to fund $445 billion in financing needs (including the wind down of $195 billion in SFP cash management bills), the Treasury has just announced it expects to need just $142 billion in Treasury issuance in the April-June quarter. This ridiculous amount is more than 50% lower than the previous estimate of $299 billion disclosed on January 31, and confirms that the Treasury is now scrambling to appear prudent to Congress with its debt needs. That it will need far, far more at the end of the day is beyond question. The reason for the over 50% plunge in borrowing needs "largely relates to higher receipts and lower outlays." Well, that's great - perhaps the treasury can explain why its preliminary cash need for the July-Sept quarter are $405 billion (compared to $396 billion a year earlier). Altogether, this advance estimate is ludicrous and shows that Geithner has totally lost a grip on reality. Yet on the other hand, in order to make his point, the market needs to crash (just like the May 6th crash killed any hope of an Audit the Fed bill). Looks like risk is duly nothing its duty to act appropriately when record 2011 bonuses are at stake.
Here are some parts of the letter from our man Timmy Geithner since its too long to post the entire thing:
"In my last letter, I described in detail the set of extraordinary measures Treasury is prepared to take in order to extend temporarily our ability to meet the Nation’s obligations if an increase is not enacted by May 16, when we estimate the limit will be reached. Because it appears that Congress will not act by May 16, it will be necessary for the Treasury to begin implementing these extraordinary measures this week. "
"On Friday, May 6, Treasury will suspend until further notice the issuance of State and Local Government Series (SLGS) Treasury securities. SLGS are special-purpose Treasury securities issued to states and municipalities to help them conform to tax rules that restrict the investment of proceeds from the issuance of tax-exempt bonds."
"If Congress does not increase the debt limit by May 16, the Treasury Department will be forced to employ further extraordinary measures on that date to provide headroom under the limit. Therefore, on May 16, I will (1) declare a “debt issuance suspension period” under the statute governing the Civil Service Retirement and Disability Fund, permitting us to redeem existing Treasury securities held by that fund as investments, and to suspend issuance of new Treasury securities to that fund as investments and (2) suspend the daily reinvestment of Treasury securities held as investments by the Government Securities Investment Fund of the Federal Employees’ Retirement System Thrift Savings Plan. (Under the law, Federal employees are protected by a requirement that both funds be made whole after a debt limit increase is enacted.) "
Thursday, April 21, 2011
Finally, its about time! Soverign Bond Trading from the CME!
So, directional trading on the bonds of France, Germany, Italy, Netherlands, UK and US?
Key features and benefits of the new contract include the following:
- Sovereign Yield Spread futures wrap a sovereign yield spread exposure into a single futures contract — with no need to execute and manage individual legs in cash bond/repo markets or across multiple futures exchanges.
- Sovereign Yield Spread futures make trading and monitoring of sovereign yield spread exposures simpler, more cost-effective, and more capital efficient than ever before.
- Sovereign Yield Spread futures are cash-settled and trade exclusively on CME Globex.
- Pair-wise spreads among 10-year sovereign bond yields of:
- France (OATs)
- Germany (Bunds)
- Italy (BTPs)
- Netherlands (DSLs)
- UK (Treasury Gilts)
- US (10-Year Treasury Notes)
- Reference Bond price evaluations provided by a designated third-party price evaluation service
- Price basis: Modified IMM Index = 100 + Yield Spread
- Yield spread = "Sold" Nation yield minus "Bought" Nation yield
- Contracts expire by cash settlement on last trading day
- Block minimum: 250 contracts
- Electronically traded on CME Globex
- Centrally cleared
Tuesday, April 19, 2011
FYI: Must Watch Charlie Rose Tomorrow (Apr 20)
Scheduled for Apr 20th, Henry Kissinger and Hillary Clinton will be interviewed on Charlie Rose!!!
Video can be seen on the web site as of thursday the 21st : http://www.charlierose.com/
Video can be seen on the web site as of thursday the 21st : http://www.charlierose.com/
Friday, April 15, 2011
China Net Seller Of US Treasurys For Fourth Consecutive Month
Zerohedge: While we will present a comprehensive update of the just released TIC data shortly, the one chart worth noting is the sequentual change in holdings by foreign countries, and particularly one of them. Importantly, of the 4 largest holders of US debt, China, Japan, the UK and Oil Exporters, the latter 3 all saw an increase in their Treasury holdings, China continues selling Treasurys, with a 4th consecutive decline in its total holdings. That said, since TIC data is notoriously flawed and always incorrect, with at least half UK purchases being attributed to China post annual revisions (nobody knows who is responsible for the other half) it could well turn out that China was the only country actually buying US paper. We won't know for sure for at least a year from now following the next full year revision. And by then it likely won't matter.

Friday, April 08, 2011
And In The Meantime, The Adjusted Monetary Base....
...is up by $51 billion in two weeks. But, once again, before people freak out that this is some crazy scheme to flood the market with money (nothing crazy about that scheme: it has been going on for 2 years), keep in mind: this is merely the delayed catch up of the SFP program unwind and the ongoing increase in Treasury holdings by the Federal Reserve Capital, ULC. Nonetheless, it is disturbing that the gradual phase out in the build up of the Adjusted Monetary Base, exclusively due to the rise in Excess Bank Reserves, is still proceeding at a 100%+ CAGR.

The variance between the accumulation in Excess Reserves (Fed liabilities) and Security Holdings (Fed assets) since the start of QE2, can be seen on the chart below. Whereas two months ago reserves were lagging the build out in assets by up to $170 billion, this has since flipped and there has been a dramatic build out in reserves to the tune of $74 billion more than assets.

Once again, there is little mystery here: the question is how much will the market discount these electronic 1 and 0s eventually entering the market, and being an inflationary force, and secondly, just how effective will an IOER hike be in order to prevent $1.7 trillion in excess reserves at the time of QE2 end (on $970 billion of currency in circulation) from becoming a hyperinflationary juggernaut.
Where there is mystery, however, is what actually comprises the Fed's "Other Assets" account which in the last week hit a new all time record of $123 billion.

The variance between the accumulation in Excess Reserves (Fed liabilities) and Security Holdings (Fed assets) since the start of QE2, can be seen on the chart below. Whereas two months ago reserves were lagging the build out in assets by up to $170 billion, this has since flipped and there has been a dramatic build out in reserves to the tune of $74 billion more than assets.
Once again, there is little mystery here: the question is how much will the market discount these electronic 1 and 0s eventually entering the market, and being an inflationary force, and secondly, just how effective will an IOER hike be in order to prevent $1.7 trillion in excess reserves at the time of QE2 end (on $970 billion of currency in circulation) from becoming a hyperinflationary juggernaut.
Where there is mystery, however, is what actually comprises the Fed's "Other Assets" account which in the last week hit a new all time record of $123 billion.
Thursday, April 07, 2011
GE Investment Arm Shedding Bond Risk on ‘Lofty’ Expectations
General Electric Co. (GE)’s investment arm is shedding commercial-mortgage securities, high-yield corporate bonds and emerging-market debt, anticipating that investor expectations for the U.S. economy will deteriorate.
GE Asset Management has been reducing holdings of riskier securities since late February, after favoring them as they rallied over the previous 14 months, said Paul Colonna, 42, who oversees about $53 billion as the Stamford, Connecticut-based unit’s chief investment officer for fixed income.
The threat of a federal-government shutdown as lawmakers wrangle over budget cuts underscores the end of the fiscal stimulus that helped the U.S. escape an 18-month recession, Colonna said. The economy faces a renewed housing slump that may extend for years as policy makers reduce government support amid a lack of “bread-winner job” creation and tepid wage growth even as unemployment falls, he said.
“There’s not enough to drag us down into a double-dip recession, but there’s enough to take down the lofty expectations that are out there and impact asset prices,” Colonna said in a telephone interview. There have been “some very, very aggressive run-ups” in credit markets, he said.
U.S. commercial-mortgage bonds have returned 20.5 percent since the end of 2009, while speculative-grade company bonds have gained 20.3 percent, according to Bank of America Merrill Lynch index data, reflecting growing confidence in the economy and the Federal Reserve’s stimulus for markets that’s pushed investors to seek high-yielding debt.
Emerging-market debentures returned 18.6 percent, while Treasuries have offered 5.3 percent, the data show.
Subscribe to:
Posts (Atom)